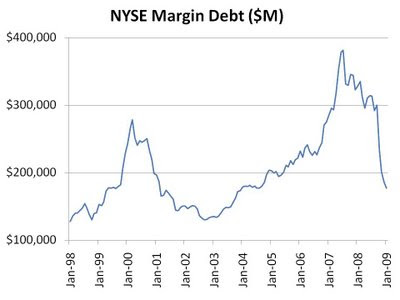
From the above chart it appears that investor sentiment is highly cyclical, as margin calls appear to force reductions of debt levels when recessions hit, while investors dramatically increase debt levels when the market rises.
Despite the negativity surrounding the current market, however, January 2009 margin debt levels are still not as low as they were in the 2002 trough which followed the last recession. Furthermore, as a percentage of the S&P 500, margin levels are still rather high by historical standards:
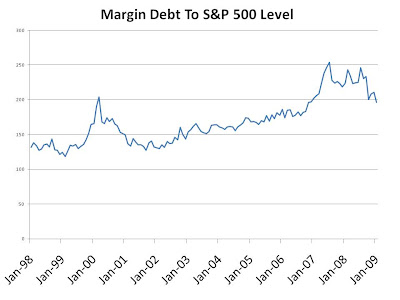
It appears that many margin investors are still holding their investments steady, despite the grim outlook for the economy, which may suggest market confidence has not yet gone as low as it can go. It's worth noting, however, that this data is only current to January, and considering the market's steep drop in February, many margin investors may have been spooked; therefore it will be interesting to revisit this data when the February stats have been compiled.
Stay Tuned!
4 comments:
Margin debt is historically quite cheap right now (it was low in 2002-2003 as well), so that may also be a factor.
From a lender's perspective, margin debt is the best kind to give--it's collateralized, and can be liquidated at your discretion if the collateral declines. That's a business I'd like to get into.
Interesting post-- I have always been curious about the source of the data posted on this blog.
In the interest of openness, can you guys share and refer to the data source?
Certainly Hyper,
The NYSE margin debt was taken from nysedata.com here, and to construct the second graph, monthly S&P 500 data was grabbed from yahoo.
Any idea where to get Canadian mortgage debt levels or even better by province and compared to average incomes in that area.
It would be great if Canada had a zillow site. I have yet to look at how they determine prices?
Post a Comment